Comparing two genomes in a dotplot
Decomposing genomes in separate blocks provides a very good starting point for pairwise comparison between genomes. The pangenome graph can easily be used to draw a dotplot between two different paths, in which lines represent shared blocks.
In this example we consider the klebs_pangraph.json graph generated from 9 complete chromosomes of Klebsiella Pneumoniae in a previous tutorial.
PyPangraph provides a convenient dotplot function to generate such a dotplot:
import pypangraph as pp
import matplotlib.pyplot as plt

# load pangraph
pan = pp.Pangraph.from_json("klebs_pangraph.json")

# paths to be compared
str_i, str_j = ["NZ_CP013711", "NC_017540"]

fig, ax = plt.subplots(figsize=(8, 8))
pp.dotplot(ax, str_i, str_j, pan, duplicated_color="silver", min_length=150)
plt.show()
Click here to see the full code, in case you want to customize it
import pypangraph as pp
import matplotlib.pyplot as plt
from collections import defaultdict
from itertools import product
from dataclasses import dataclass

@dataclass
class Segment:
    """
    Representation for a node of a path as a segment,
    with a start and end coordinate and a strandedness.
    """

    start: int
    end: int
    strand: bool

    def flip(self):
        """
        Flip the segment orientation.
        Exchange start and end coordinates and flip the strandedness.
        """
        return Segment(self.end, self.start, not self.strand)

    def length(self, L):
        """
        Calculate the length of the segment.
        If total path length L is provided, calculate the length modulo L.
        """
        if L is None:
            return self.end - self.start
        else:
            return (self.end - self.start) % L

    def crosses_origin(self):
        """
        Check if the segment crosses the origin, i.e. start > end
        """
        return self.start > self.end

    def split_across_origin(self, L):
        """
        Split the segment into two segments if it crosses the origin.
        """
        assert self.crosses_origin()
        s1 = Segment(self.start, L, self.strand)
        s2 = Segment(0, self.end, self.strand)
        f = s1.length(L) / self.length(L)
        return s1, s2, f

    def split_fraction(self, f, flip, L):
        """
        Split the segment into two segments based on a fraction of the segment length
        """
        assert 0 <= f <= 1
        l = self.length(L)
        l1, l2 = f * l, (1 - f) * l
        if flip:
            l1, l2 = l2, l1
        s1 = Segment(self.start, (self.start + l1) % L, self.strand)
        s2 = Segment((self.end - l2) % L, self.end, self.strand)
        return s1, s2


def block_segment_dictionary(graph, path_name):
    """
    Create a dictionary of block -> segments for a given path in the graph.
    """
    path_id = graph.paths[path_name].id
    block_sgm = defaultdict(list)
    for bid, block in graph.blocks.items():
        for nid in block.alignment.node_ids():
            node = graph.nodes[nid]
            if node.path_id == path_id:
                sgm = Segment(node.start, node.end, node.strand)
                block_sgm[bid].append(sgm)
    return dict(block_sgm)


def linear_plot(ax, sgm_i, sgm_j, **kwargs):
    """
    Dotplot for two segments
    """
    if sgm_i.strand != sgm_j.strand:
        linear_plot(ax, sgm_i, sgm_j.flip(), **kwargs)
    else:
        ax.plot([sgm_i.start, sgm_i.end], [sgm_j.start, sgm_j.end], **kwargs)


def circular_plot(ax, sgm_i, sgm_j, Li, Lj, **kwargs):
    """
    Dotplot for two segments, considering circular genomes.
    """
    if sgm_i.crosses_origin():
        si1, si2, f = sgm_i.split_across_origin(Li)
        flip = sgm_i.strand != sgm_j.strand
        sj1, sj2 = sgm_j.split_fraction(f, flip, Lj)
        circular_plot(ax, si1, sj1, Li, Lj, **kwargs)
        circular_plot(ax, si2, sj2, Li, Lj, **kwargs)
    elif sgm_j.crosses_origin():
        sj1, sj2, f = sgm_j.split_across_origin(Lj)
        flip = sgm_i.strand != sgm_j.strand
        si1, si2 = sgm_i.split_fraction(f, flip, Li)
        circular_plot(ax, si1, sj1, Li, Lj, **kwargs)
        circular_plot(ax, si2, sj2, Li, Lj, **kwargs)
    else:
        linear_plot(ax, sgm_i, sgm_j, **kwargs)


def dotplot(
    ax,
    strain_i,
    strain_j,
    graph,
    block_color="black",
    no_duplicates=False,
    duplicated_color="silver",
    min_length=None,
    circular=True,
):
    """
    Creates a dotplot comparing two paths.

    Parameters:
    ax (matplotlib.axes.Axes): The matplotlib axes object where the plot will be drawn.
    strain_i (str): The identifier for the first path.
    strain_j (str): The identifier for the second path.
    graph (Graph): pangenome graph object.
    block_color (str, optional): The color used for non-duplicated blocks. Defaults to "black".
    no_duplicates (bool, optional): If True, duplicated blocks will not be plotted. Defaults to False.
    duplicated_color (str, optional): The color used for duplicated blocks. Defaults to "silver".
    min_length (int, optional): Minimum length of blocks to be plotted. Defaults to None.
    circular (bool, optional): If True, plots the segments in a circular layout. If False, uses a linear layout. Defaults to True.
    """
    # Create block segment dictionaries for the paths
    bs_i = block_segment_dictionary(graph, strain_i)
    bs_j = block_segment_dictionary(graph, strain_j)

    # Get the nucleotide lengths of the paths
    Li = graph.paths[strain_i].nuc_len
    Lj = graph.paths[strain_j].nuc_len

    # Plot the segments
    for bid, seg_i in bs_i.items():
        if bid not in bs_j:
            continue
        color = block_color
        seg_j = bs_j[bid]

        if min_length is not None:
            # optionally skip short blocks
            block_len = len(graph.blocks[bid].consensus())
            if block_len < min_length:
                continue

        if (len(seg_i) > 1) or (len(seg_j) > 1):
            if no_duplicates:
                continue
            # color duplicated blocks in gray
            color = duplicated_color

        for si, sj in product(seg_i, seg_j):
            if circular:
                circular_plot(ax, si, sj, Li, Lj, color=color)
            else:
                linear_plot(ax, si, sj, color=color)

# Load the Pangraph from a JSON file
pan = pp.Pangraph.from_json("klebs_pangraph.json")

# paths to be compared
str_i, str_j = ["NZ_CP013711", "NC_017540"]

fig, ax = plt.subplots(figsize=(8, 8))
dotplot(ax, str_i, str_j, pan)
plt.tight_layout()
plt.show()
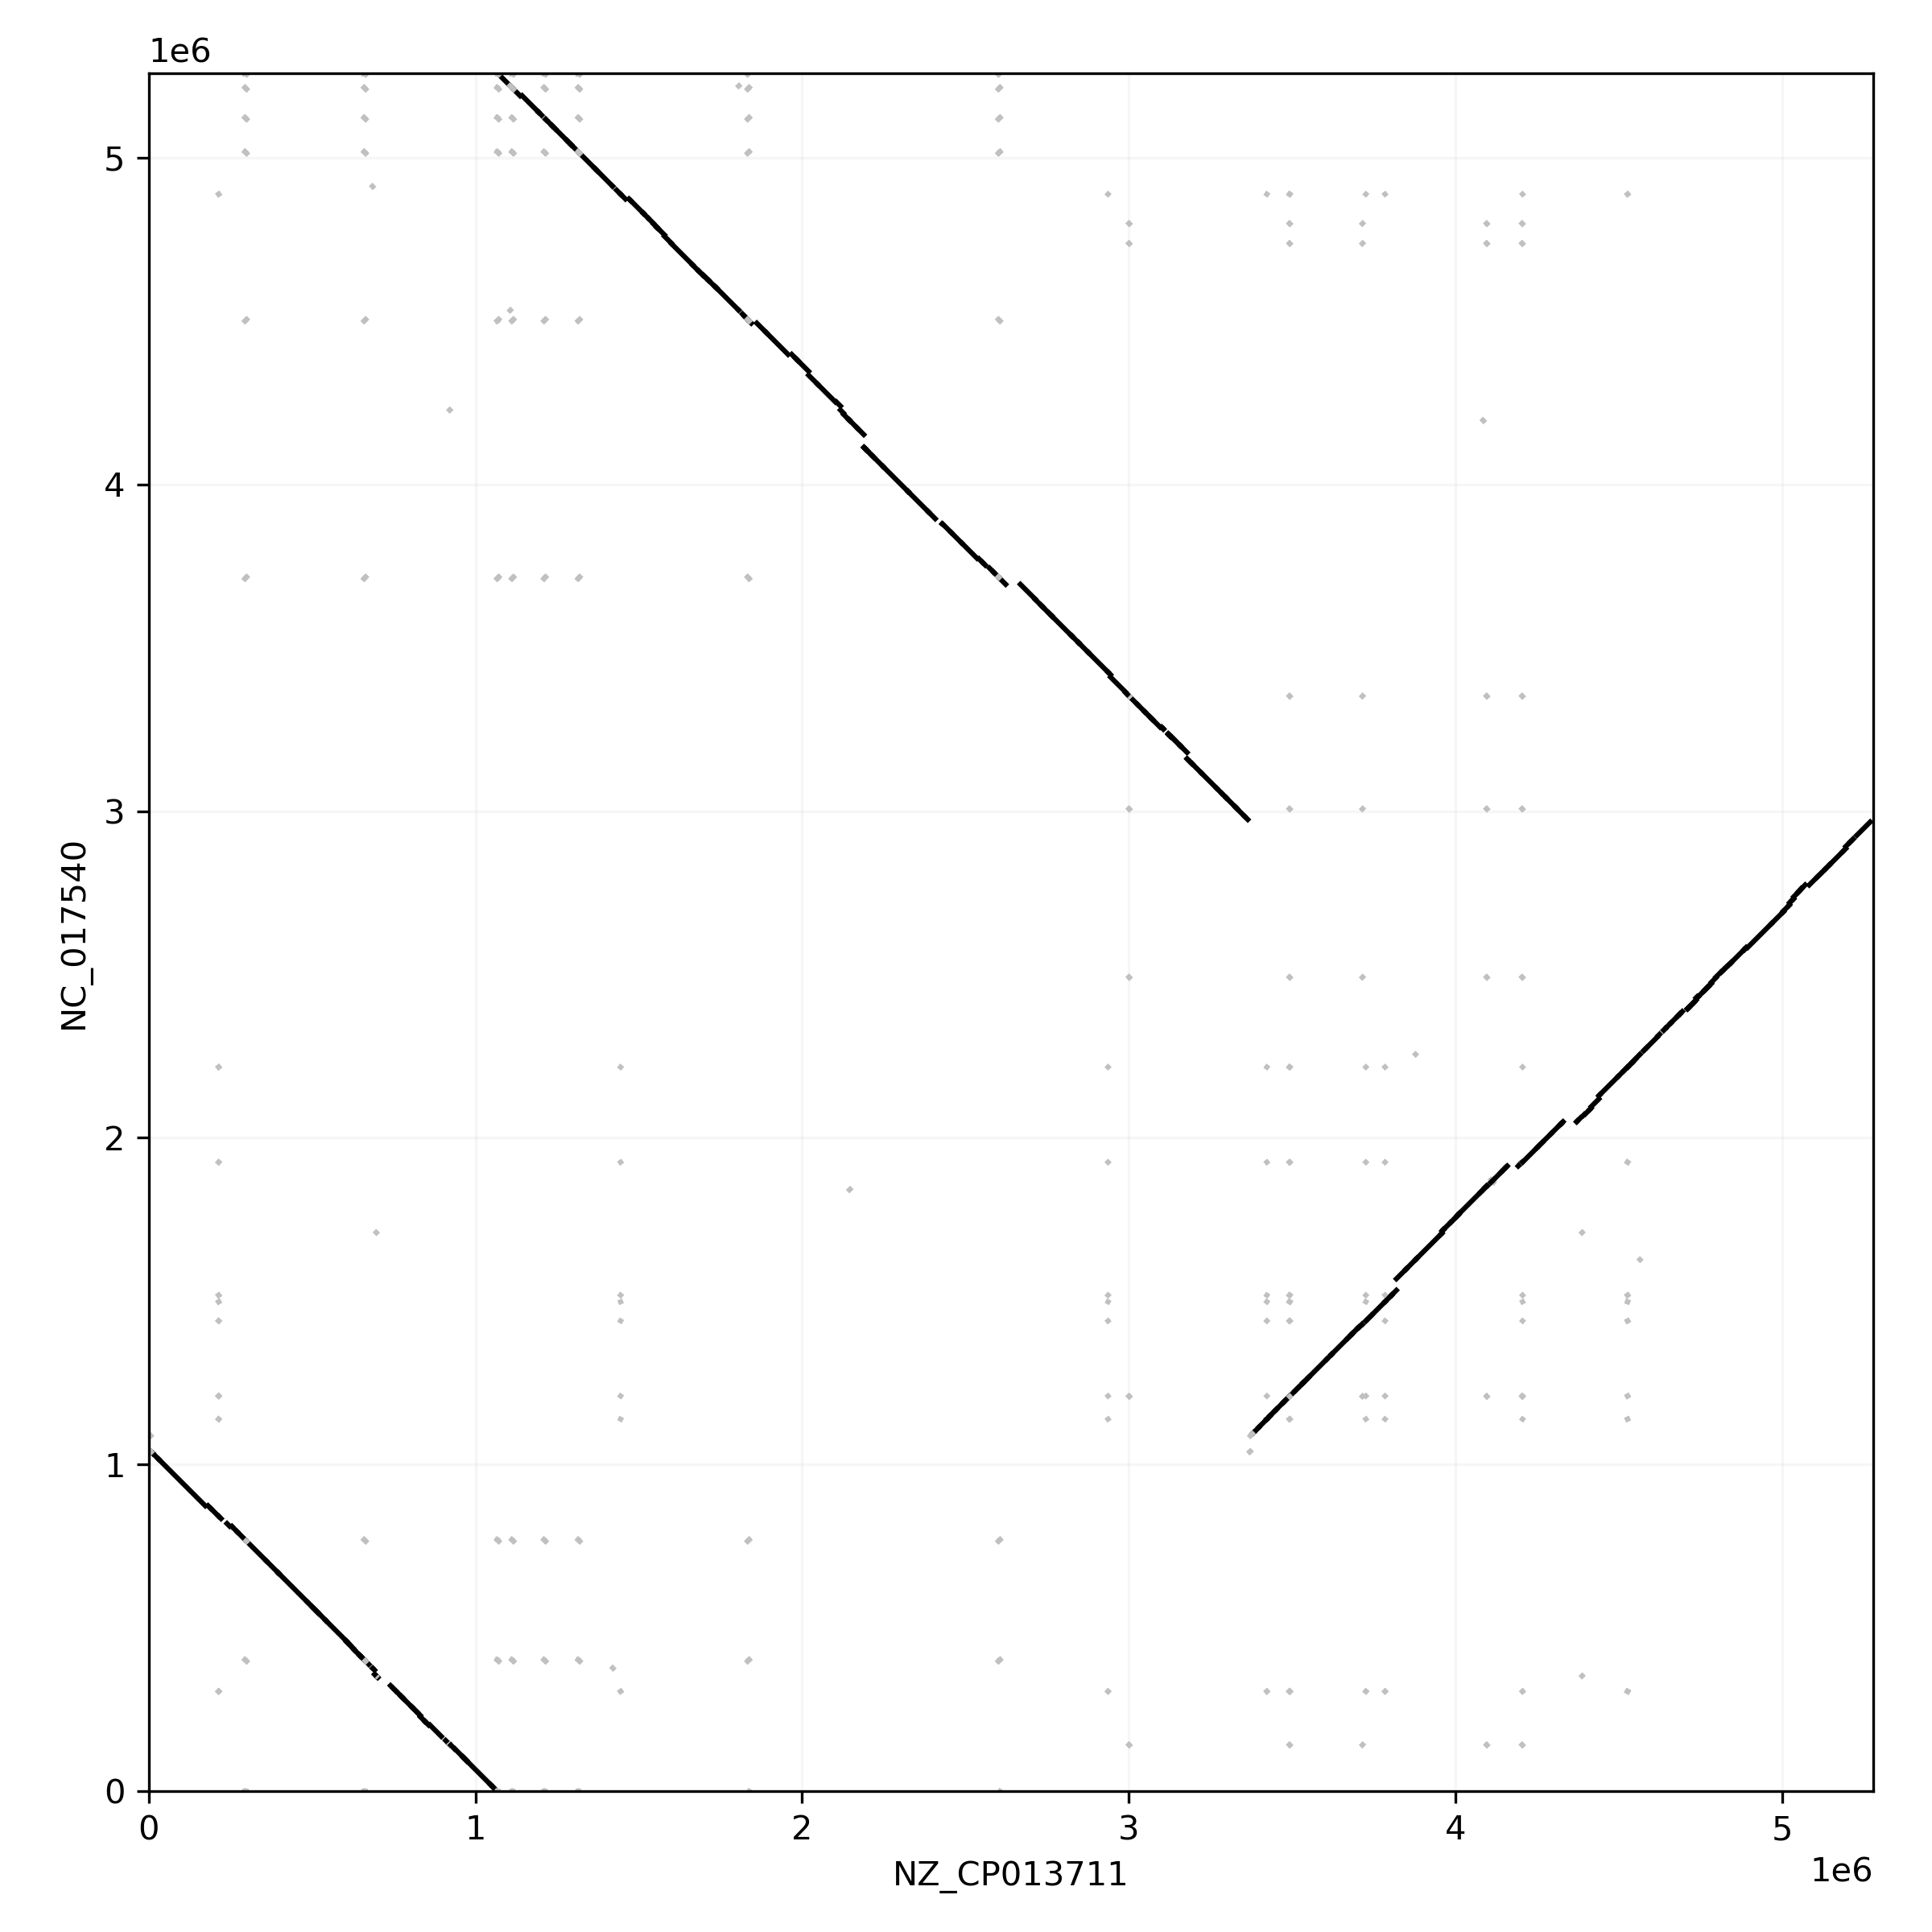
Block that are not duplicated between the two paths are displayed in black. We observe that the chromosomes differ in a large inversion.
Duplicated blocks are depicted in gray. These form a checkerboard pattern, typical of blocks that are repeated multiple times on the genome. We can get the list of most duplicated blocks using the to_blockstats_df method:
df = pan.to_blockstats_df()
df[df["duplicated"]].sort_values("count", ascending=False).head(3)

# block_id              count  n_strains  duplicated   core   len
# 3121046370622183165     101          9        True  False   236
# 17902739066067298048     72          9        True  False  1733
# 9722346788777533867      72          9        True  False  3062
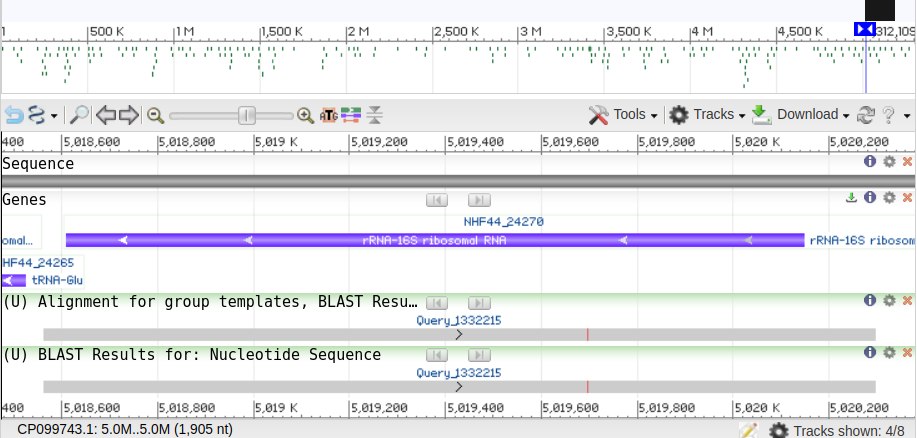
It is also easy to retrieve the consensus sequence of one of these blocks with:
b = pan.blocks[17902739066067298048]
print(b.consensus())
# TTCATCAGACAATCTGTGTGAGCACTACAAAGGCAGGTTCTTTAAGGTAAGGA...
Nucleotide blast of this sequence reveals a match with the 16S ribosomal RNA gene.